Share

0
/5
(
0
)

In the hectic world of trading, gaining an edge often means understanding the market's workings in real-time. This is where order flow trading comes in. Unlike traditional strategies that rely on historical data or lagging indicators, order flow trading gives traders a direct window into the market's current buying and selling activity.
By analysing the flow of orders, market liquidity, and volume, traders can gain deep insights into supply and demand dynamics, enabling them to accurately anticipate price moves.
This article will tell you what order flow trading is and how it works. You will also learn about the advantages of this type of trading and its components.
Key Takeaways
Order flow trading provides traders with live data on market sentiment, allowing for faster and more accurate decisions based on current buy and sell activity.
By analysing order books, traders can gauge supply and demand imbalances, helping identify key price levels and predict potential market movements.
Scalpers and day traders benefit from order flow trading by gaining more precise entry and exit points, improving decision-making in volatile markets.
What is Order Flow Trading?
Order flow trading is a method of analysing the buying and selling activity within financial markets. It involves studying the volume and patterns of orders being placed and executed, providing insights into market participants' real-time intentions and actions.
Unlike traditional methods that rely on historical price data, order flow trading focuses on the immediate interaction between buyers and sellers, giving traders a deeper understanding of market dynamics.
Awareness of the mechanics of order flow is crucial for anyone looking to gain an edge in the market. By interpreting the movement of large orders or shifts in liquidity, traders can better anticipate price moves, adjust strategies, and capitalise on short-term opportunities. This real-time data offers a more granular view of supply and demand imbalances, which can significantly impact market behaviour.
While order flow trading aligns more with technical analysis, its real-time focus makes it distinct. Where technical analysis looks at price patterns and indicators based on past data, order flow zeroes in on current activity.
On the other hand, fundamental analysis focuses on broader economic factors like earnings reports or macroeconomic data. Order flow trading can complement both approaches by offering insights into the market's immediate reaction to news or events.
[aa quote-global]
Fast Fact
Order flow can be used independently, without charts, to enter and exit the market. However, it's essential to recognise different market conditions, as they require specific or adjusted setups.
[/aa]
Components of Order Flow Trading
Order flow chart trading involves using specialised tools and charts that provide insight into the flow of buy and sell orders in real-time. These components help traders interpret market activity beyond traditional price charts. Here are the key components of order flow chart trading:
Order Book (Depth of Market — DOM)
The order book, the depth of market (DOM), provides a real-time display of all active buy and sell limit orders. It offers a comprehensive view of the number of orders awaiting execution at different price levels, offering valuable insights into liquidity distribution. These are the main elements of DOM:
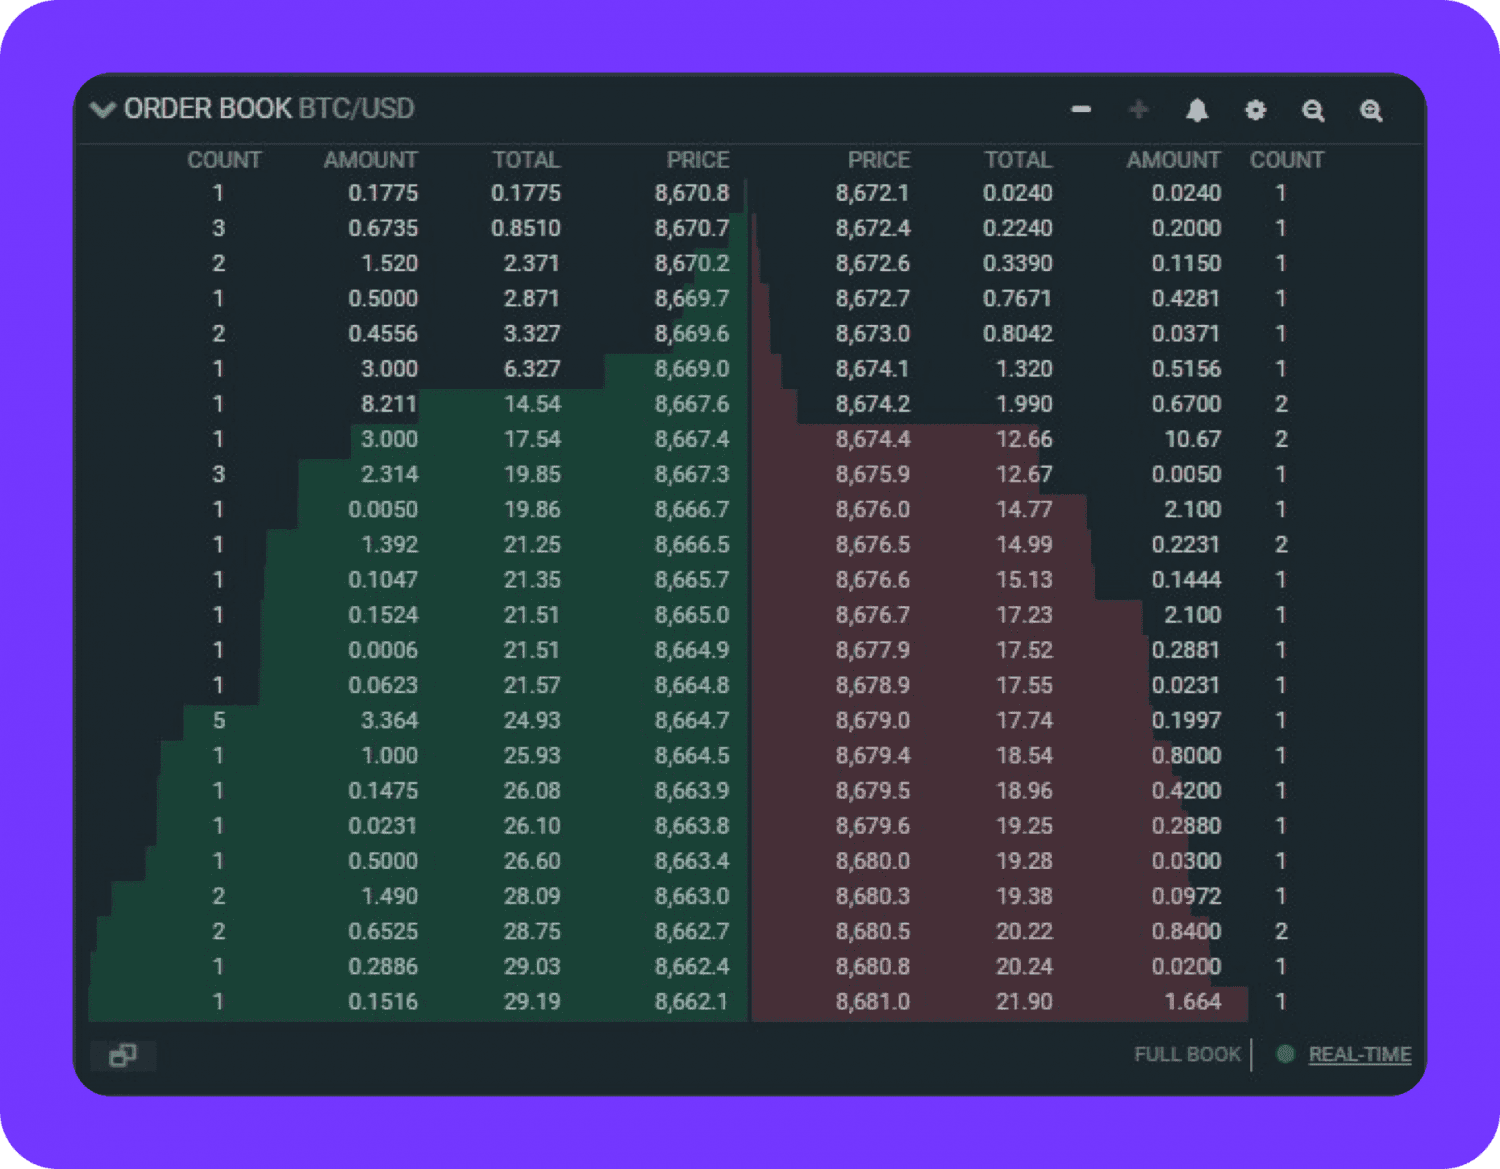
Buy Orders (Bid): This section indicates the cumulative volume of purchasing interest at specific price levels, reflecting the depth of buyer activity in the market.
Sell Orders (Ask): This section represents the total volume of selling interest at specific price levels, providing a view of the distribution of seller activity across different price levels.
Bid-Ask Spread: This is the disparity between the highest buy (bid) price and the lowest sell (ask) price. A narrower spread suggests a more liquid market, while a wider spread may indicate lower liquidity.
Liquidity Zones: These zones are concentrations of substantial buy or sell orders at specific price levels, which can act as potential support or resistance zones within the market.
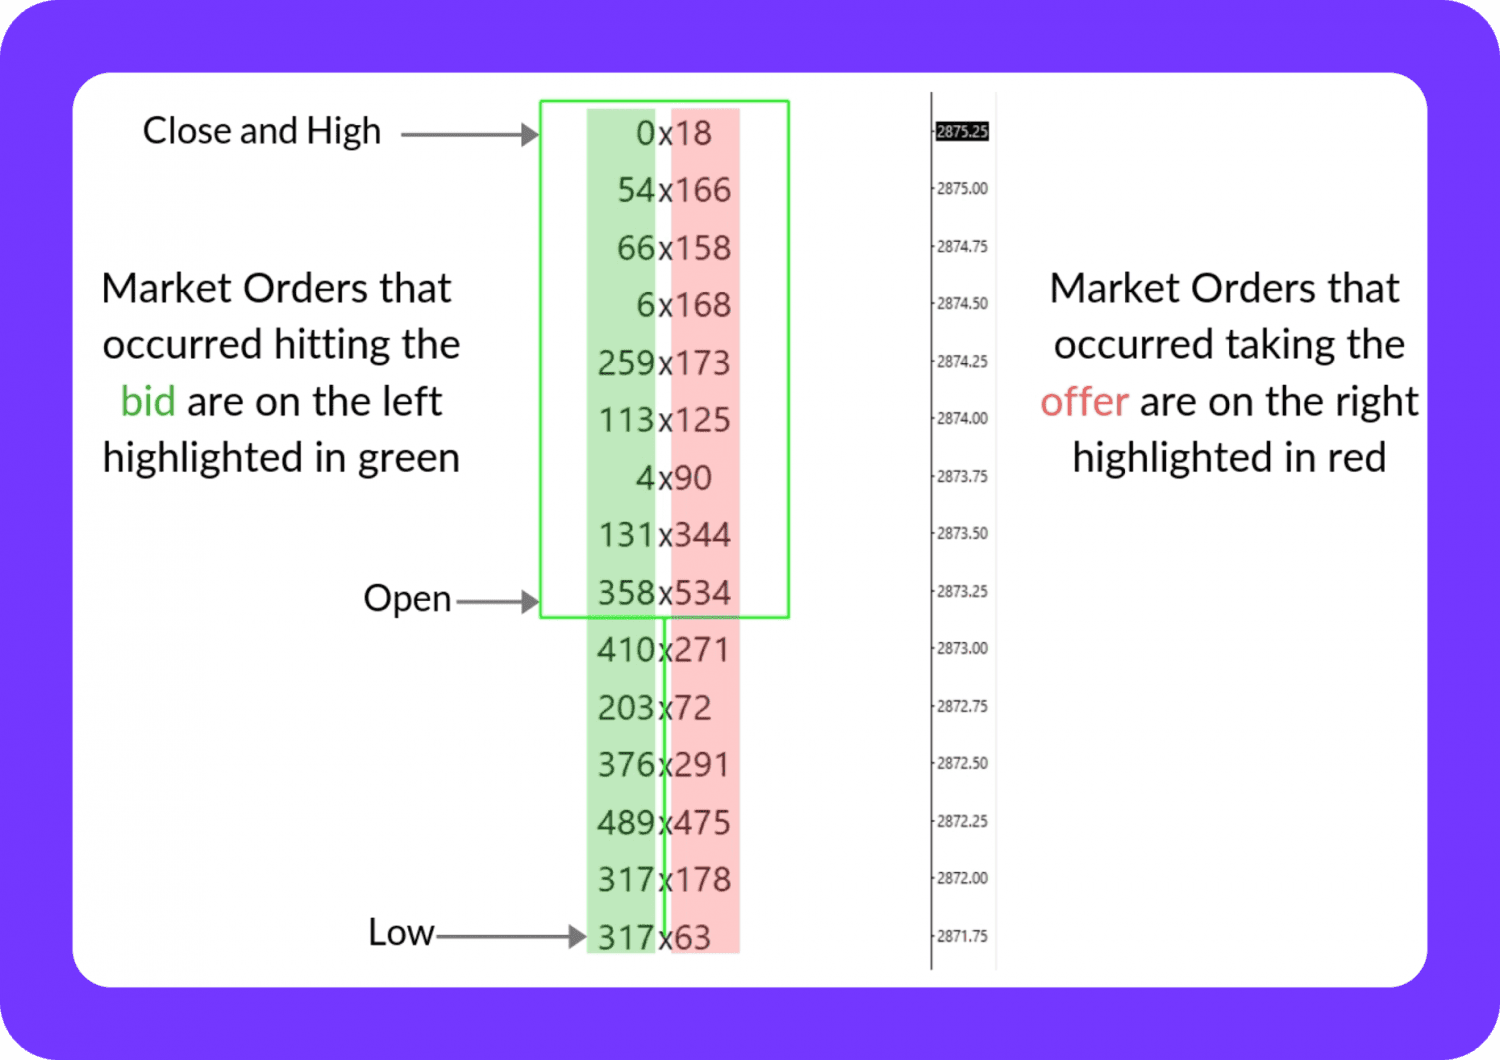
Footprint Charts
Charts showing the activity at each price level, including the volume of contracts or shares bought and sold, are called footprint charts. These charts allow traders to see the exact amount of buying or selling at specific prices. They display the precise number of trades on the bid (sell) or ask (buy) side of the market.
Delta represents the divergence between the number of buy and sell market orders at a given price level. A positive delta indicates buyer dominance, while a negative delta indicates seller dominance.
Footprint charts also point out areas where significant buying or selling imbalances occur, often indicating areas of support or resistance.
Time and Sales (Tape Reading)
The time and sales window, often referred to as “the tape,” shows a real-time stream of executed trades, including the price, size, and time of each trade. It allows traders to gauge market sentiment based on the aggressiveness of buyers and sellers.
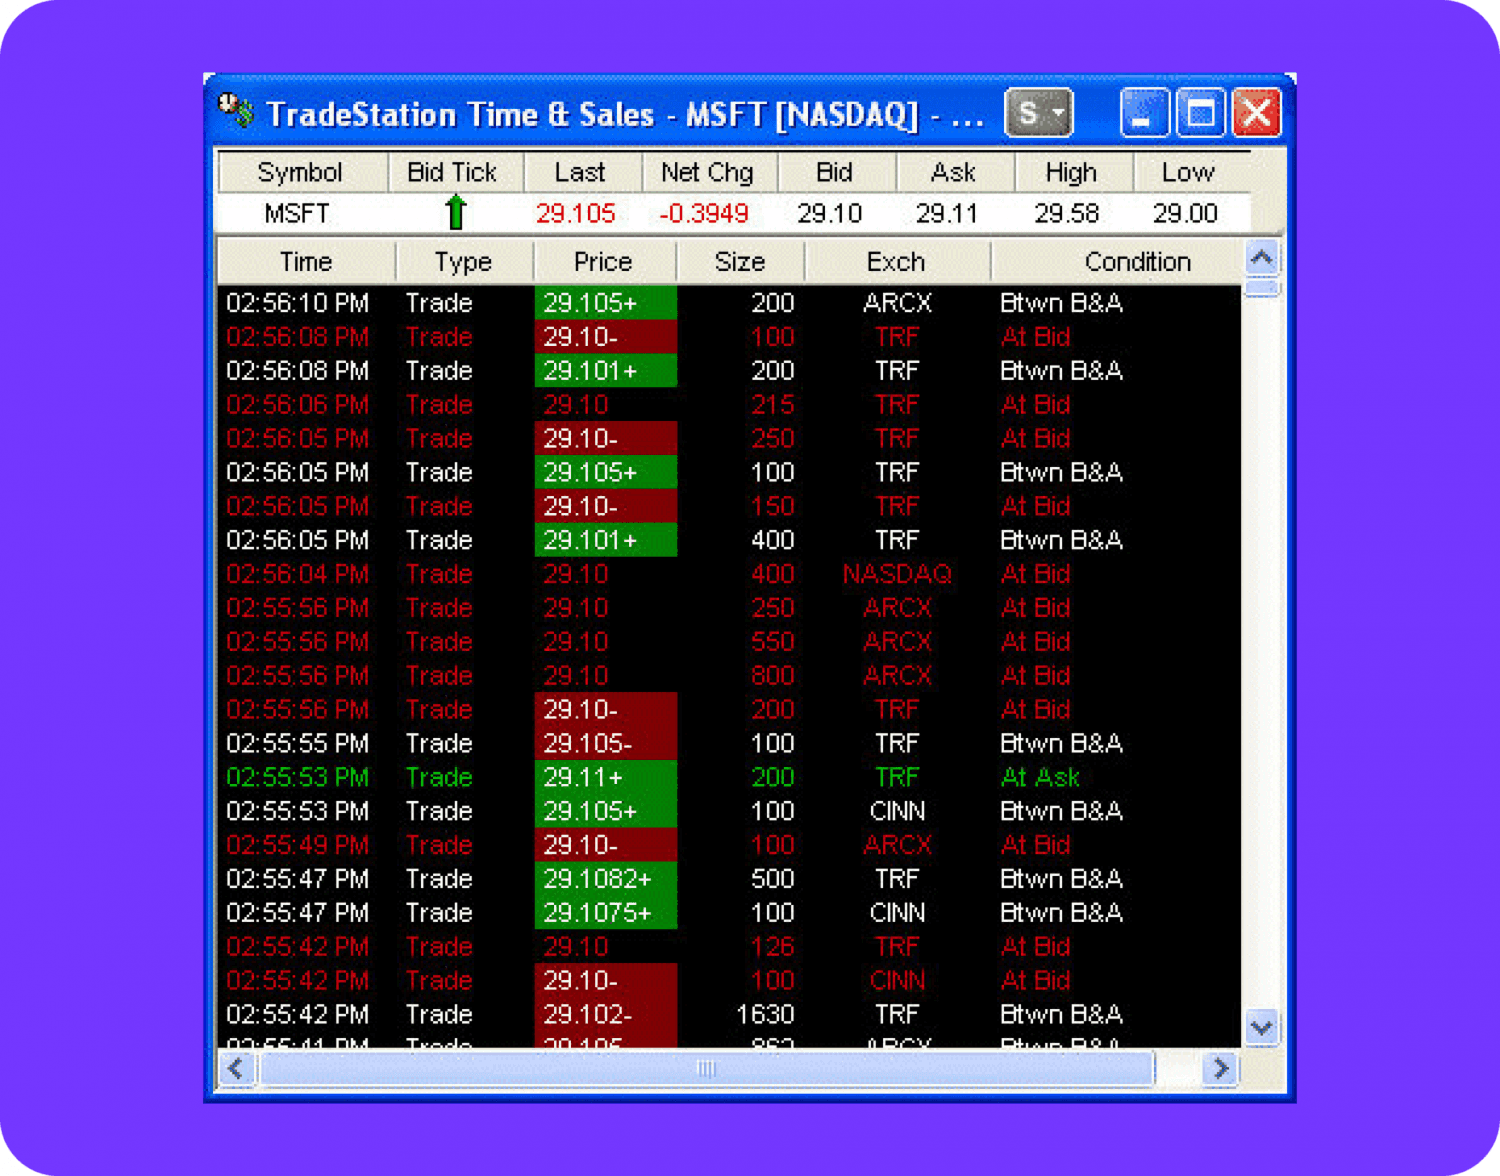
Large trade sizes may indicate institutional activity, while smaller trades could be from retail traders.
A rapid increase in the number of trades or the speed at which they occur can indicate a shift in momentum.
Watching trades at specific price levels helps traders identify key zones of interest where large buyers or sellers are active.
Cumulative Volume Delta (CVD)
The cumulative volume delta measures the overall difference between buying and selling pressure over a period of time. It adds up the variance between market buy and sell orders, offering a clearer perspective of the general market sentiment. This metric has next elements:
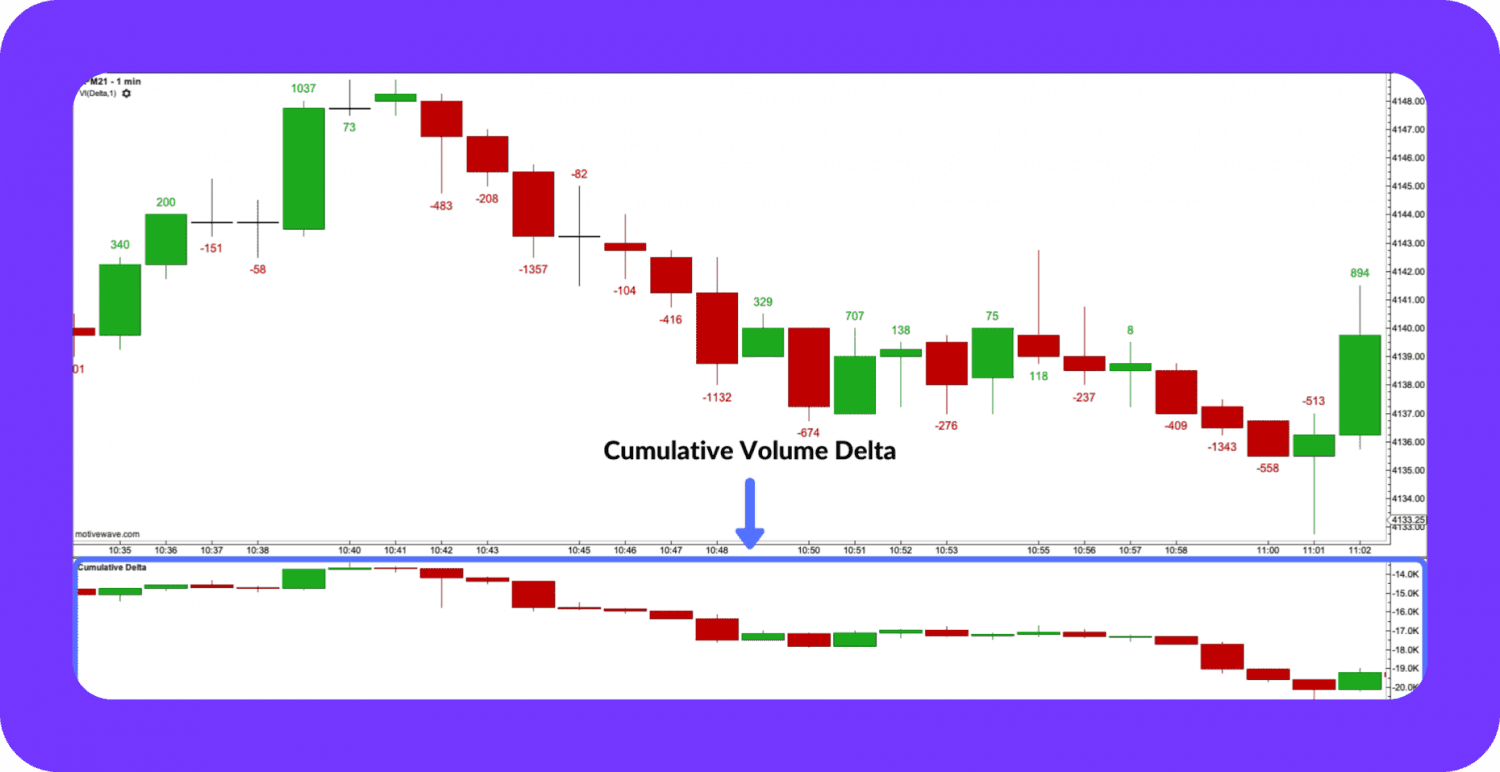
Increasing CVD: Suggests that buy market orders surpass sell market orders, indicating a bullish sentiment.
Decreasing CVD: Suggests that sell market orders surpass buy market orders, indicating a bearish sentiment.
Divergence: Traders seek discrepancies between CVD and price movements. For instance, if the price increases but CVD decreases, it could imply a decrease in buying pressure.
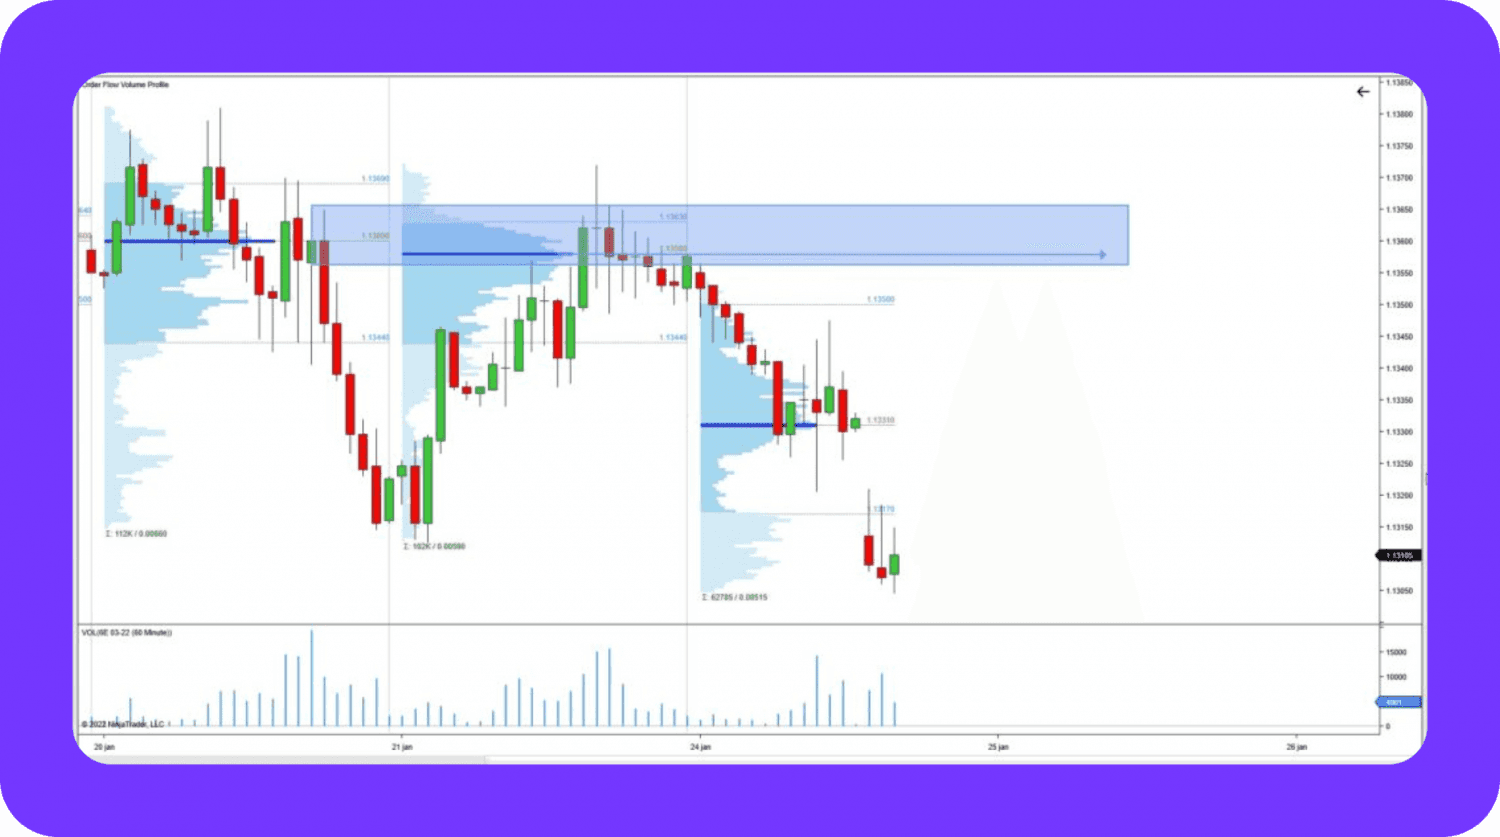
Volume Profile
A volume profile is a graphical representation of the trading volume at each price level over a specific period. Unlike traditional volume indicators, which only show volume for each time interval, the volume profile shows the volume distribution across price levels. It consists of the next variables:
Point of Control (POC): The price level where the most volume was traded. It is often a magnet for price action and can serve as a strong support or resistance level.
High Volume Nodes (HVNs): Areas on the volume profile where significant trading occurred, often indicating areas of market acceptance.
Low Volume Nodes (LVNs): Areas with little trading volume often suggest that the market may move quickly through these levels due to a lack of interest.
Liquidity Sweep and Absorption
Liquidity sweep and absorption are concepts that help traders understand how large orders are interacting with the market:

Liquidity sweep occurs when a large order sweeps through multiple price levels, absorbing available liquidity. For example, a large buy order quickly consumes all sell orders at several price levels can lead to a sharp upward price movement.
Absorption happens when large buy or sell orders are consistently filled without significant price movement. This can indicate a potential reversal, as the market absorbs the buying or selling pressure without advancing.
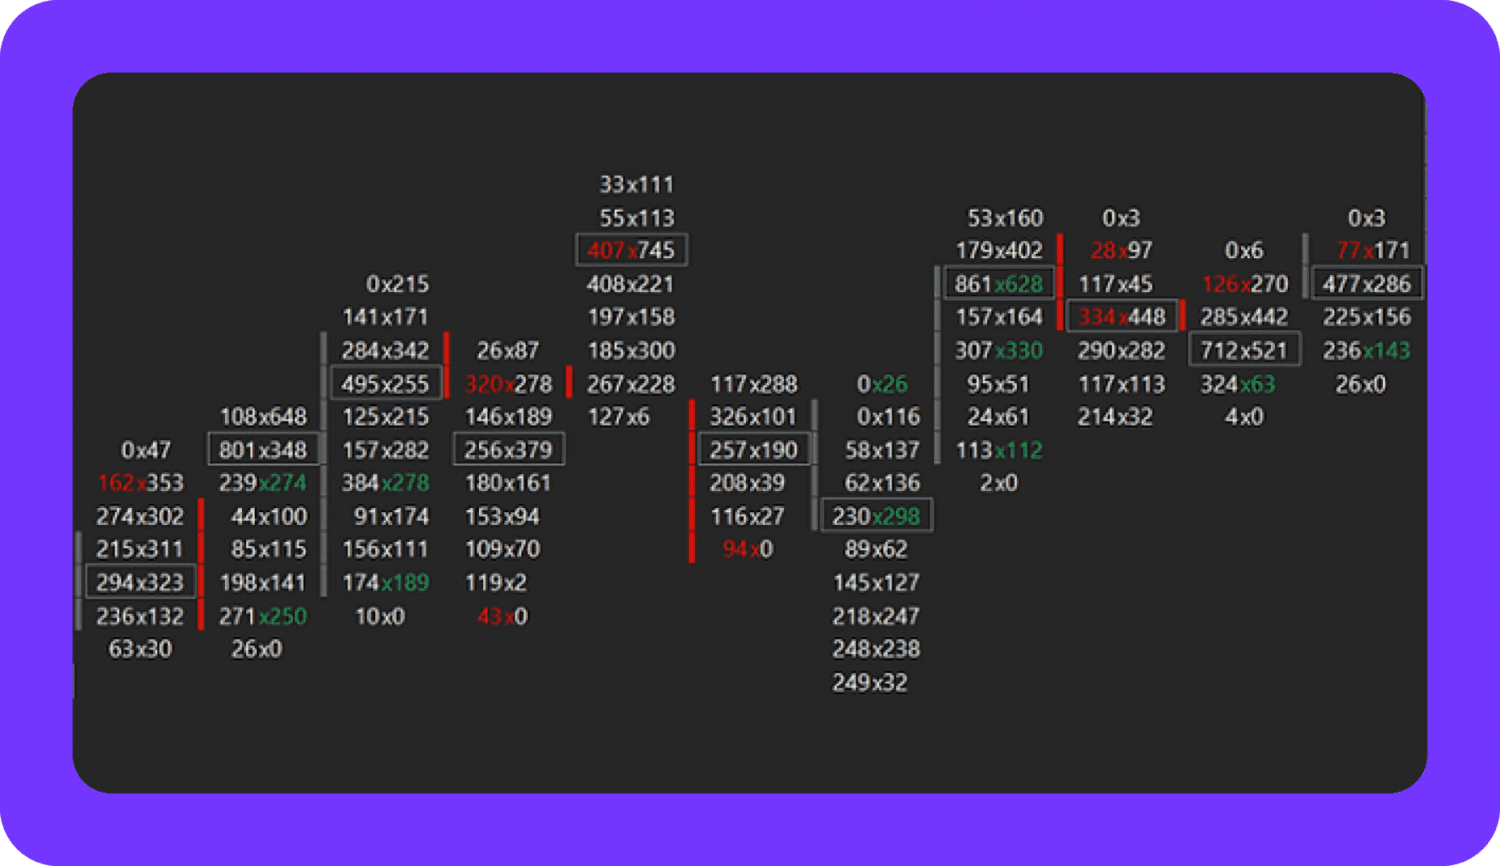
Imbalance Indicators
Imbalance indicators show areas of significant buying or selling pressure in the market. They highlight the difference between buy and sell orders at specific price levels, which can help identify potential turning points in the market.
If the volume of buy orders far exceeds sell orders at a given price, it indicates strong buying pressure. Conversely, a sell imbalance signals selling pressure. Imbalances often occur near key price levels, where reversals or breakouts are likely to happen.
Trading DOM (Depth of Market) Ladders
DOM ladders display the order flow trading book in a ladder format, allowing traders to quickly visualise and interact with the market's buy and sell orders. This tool is essential for scalpers and day traders.
The ladder shows available buy and sell orders at various price levels. Traders can use this to monitor shifts in liquidity. Some platforms allow traders to place and adjust orders directly on the DOM ladder for quick execution.
Bid-Ask Volume Heatmap
The bid-ask volume heatmap visually represents the distribution of buy and sell orders at various price levels over a specific period. The colours on the heatmap indicate the relative intensity of trading activity, with darker colours signifying higher order volumes and lighter colours indicating lower volumes. Traders use this tool to pinpoint areas where significant buy or sell orders are being placed, which can help them identify potential support or resistance levels.
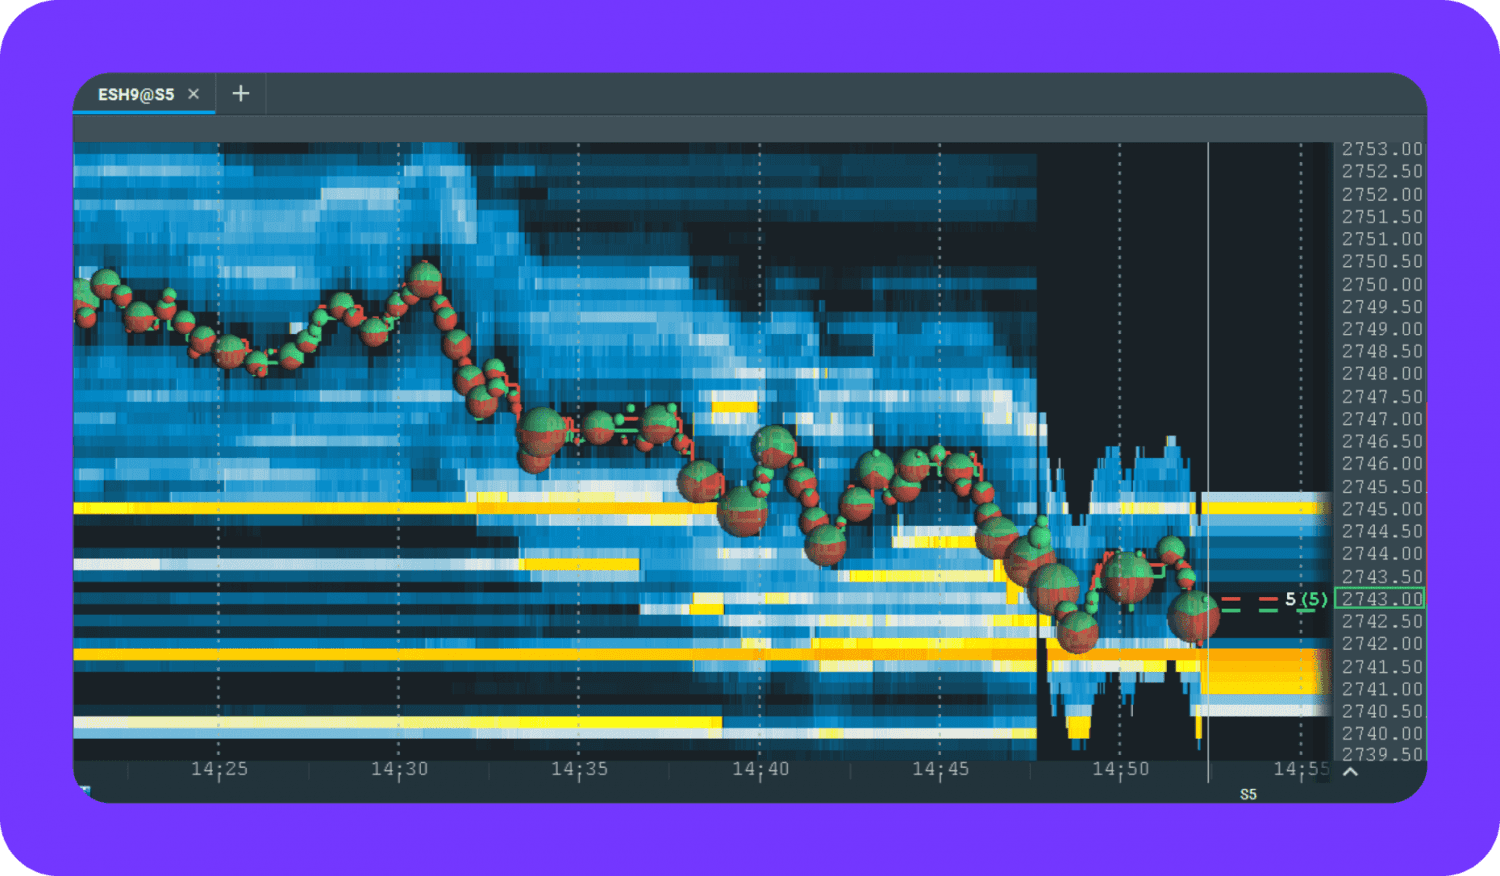
Additionally, traders pay close attention to large clusters of buy or sell orders at specific price levels, as these can indicate areas of strong support or resistance. By observing how the heatmap changes over time, traders can also detect shifts in market sentiment, such as the emergence of substantial sell orders in an area previously dominated by buy orders. This information allows traders to adapt strategies based on evolving order flow dynamics.
Benefits of Order Flow Trading
Order flow trading strategy offers certain advantages when used in practice. The key ones are the following:
Real-Time Market Insight
Order flow trading provides up-to-the-minute data on buying and selling activity, offering traders a real-time understanding of market sentiment. Unlike lagging indicators, it allows for immediate reaction to market dynamics.
Understanding Supply and Demand
By analysing the order book and executed trades, traders can assess the balance of supply (sell orders) and demand (buy orders). This helps predict price oscillations based on market pressure.
Improved Decision-Making
Traders gain deeper insight into market intentions by seeing the orders placed and executed. This information can improve decision-making, especially in short-term trades where timing is critical.
Identification of Key Price Levels
Order flow allows traders to identify areas of significant support and resistance based on clusters of limit orders. This makes it easier to spot potential breakout or reversal points.
Early Detection of Large Market Moves
Large market participants, such as institutions, often leave clues through their orders. Order flow traders can detect large order imbalances or iceberg orders (hidden large trades), indicating impending big market moves.
Enhanced Scalping and Day Trading
Order flow trading offers scalpers and day traders the precision for fast, short-term trades. They can enter and exit positions at optimal points by monitoring incoming orders and volume.
Reduced Dependence on Lagging Indicators
Unlike traditional technical indicators (e.g., moving averages), which rely on historical price data, order flow trading gives traders direct insight into current market activity. This reduces the lag in decision-making.
Increased Market Transparency
Order flow shows the intentions of market participants, providing transparency in market behaviour. Traders can see where liquidity is concentrated and where large orders are waiting, giving them a clearer picture of the market landscape.
Adapting to Market Microstructure
Understanding how orders are filled and how the market responds to large trades can help traders navigate the market microstructure more effectively. This knowledge helps mitigate risks such as slippage and market manipulation.
Combining with Other Strategies
Order flow trading can complement other strategies like technical or fundamental analysis. For instance, traders can use order flow to confirm signals from chart patterns or economic news, enhancing the overall effectiveness of their strategy.
Conclusion
Order flow trading offers a unique and powerful way to gain real-time insights into the market by analysing the actual flow of buy and sell orders. Unlike traditional trading strategies that rely on historical records and lagging indicators, order flow trading allows traders to see the intentions of market participants as they happen, providing a deeper understanding of supply, demand, and liquidity.
Using tools like the order book, time and sales, and footprint charts, traders can identify key price levels, spot large market moves early, and make more deliberate decisions.
While order flow trading requires access to sophisticated platforms and a steep learning curve, its ability to offer real-time transparency and improve short-term decision-making makes it an invaluable strategy, particularly for active traders like scalpers and day traders.
FAQ
What is order flow trading?
Order flow trading is a strategy that involves analysing the flow of buy and sell orders in the market to anticipate future price movements. It studies the order book, executed trades, and other real-time market data by understanding market sentiment, liquidity, and supply and demand.
How does order flow trading differ from technical analysis?
Order flow trading analyses live market data (orders, trades, volume), while technical analysis relies on historical price charts and lagging indicators like moving averages or oscillators.
How does order flow trading help identify support and resistance levels?
Traders can identify support and resistance by looking at clusters of limit orders in the order book. If there are many buy orders at a certain price level, it could act as support. Similarly, a high concentration of sell orders may signal resistance.
What is the bid-ask spread, and why is it important in order flow trading?
The bid-ask spread is the disparity between the highest price a buyer is willing to pay (bid) and the lowest price a seller is willing to accept (ask).
Read also


B2CORE