Share
0
/5
(
0
)
Information has become the lifeblood of contemporary society, fundamentally transforming how we live, work, and interact. Nowadays, understanding user behaviour, optimising processes, and making informed decisions are vital for businesses.
This is where Amplitude Analytics comes in - a powerful tool that goes beyond basic analytics, enabling companies to gain actionable insights. Unlike traditional tools focusing on surface-level metrics, it allows for a deep dive into user behaviour, empowering data analysts and business leaders with the insights needed for strategic growth.
In this Amplitude Analytics review, we'll explore how it supports the data analysis process and why it's increasingly popular for businesses of all sizes.
Key Takeaways
Amplitude is an advanced platform for businesses that prioritises user behaviour analysis over basic web metrics.
It enables a full suite of data analysis methods, from funnel analysis to cohort segmentation and predictive analytics.
For companies focusing on product analytics, Amplitude outperforms traditional analysis tools like Google Analytics by delivering specialised features such as retention analysis and behavioural graphing.
What is Amplitude Analytics?
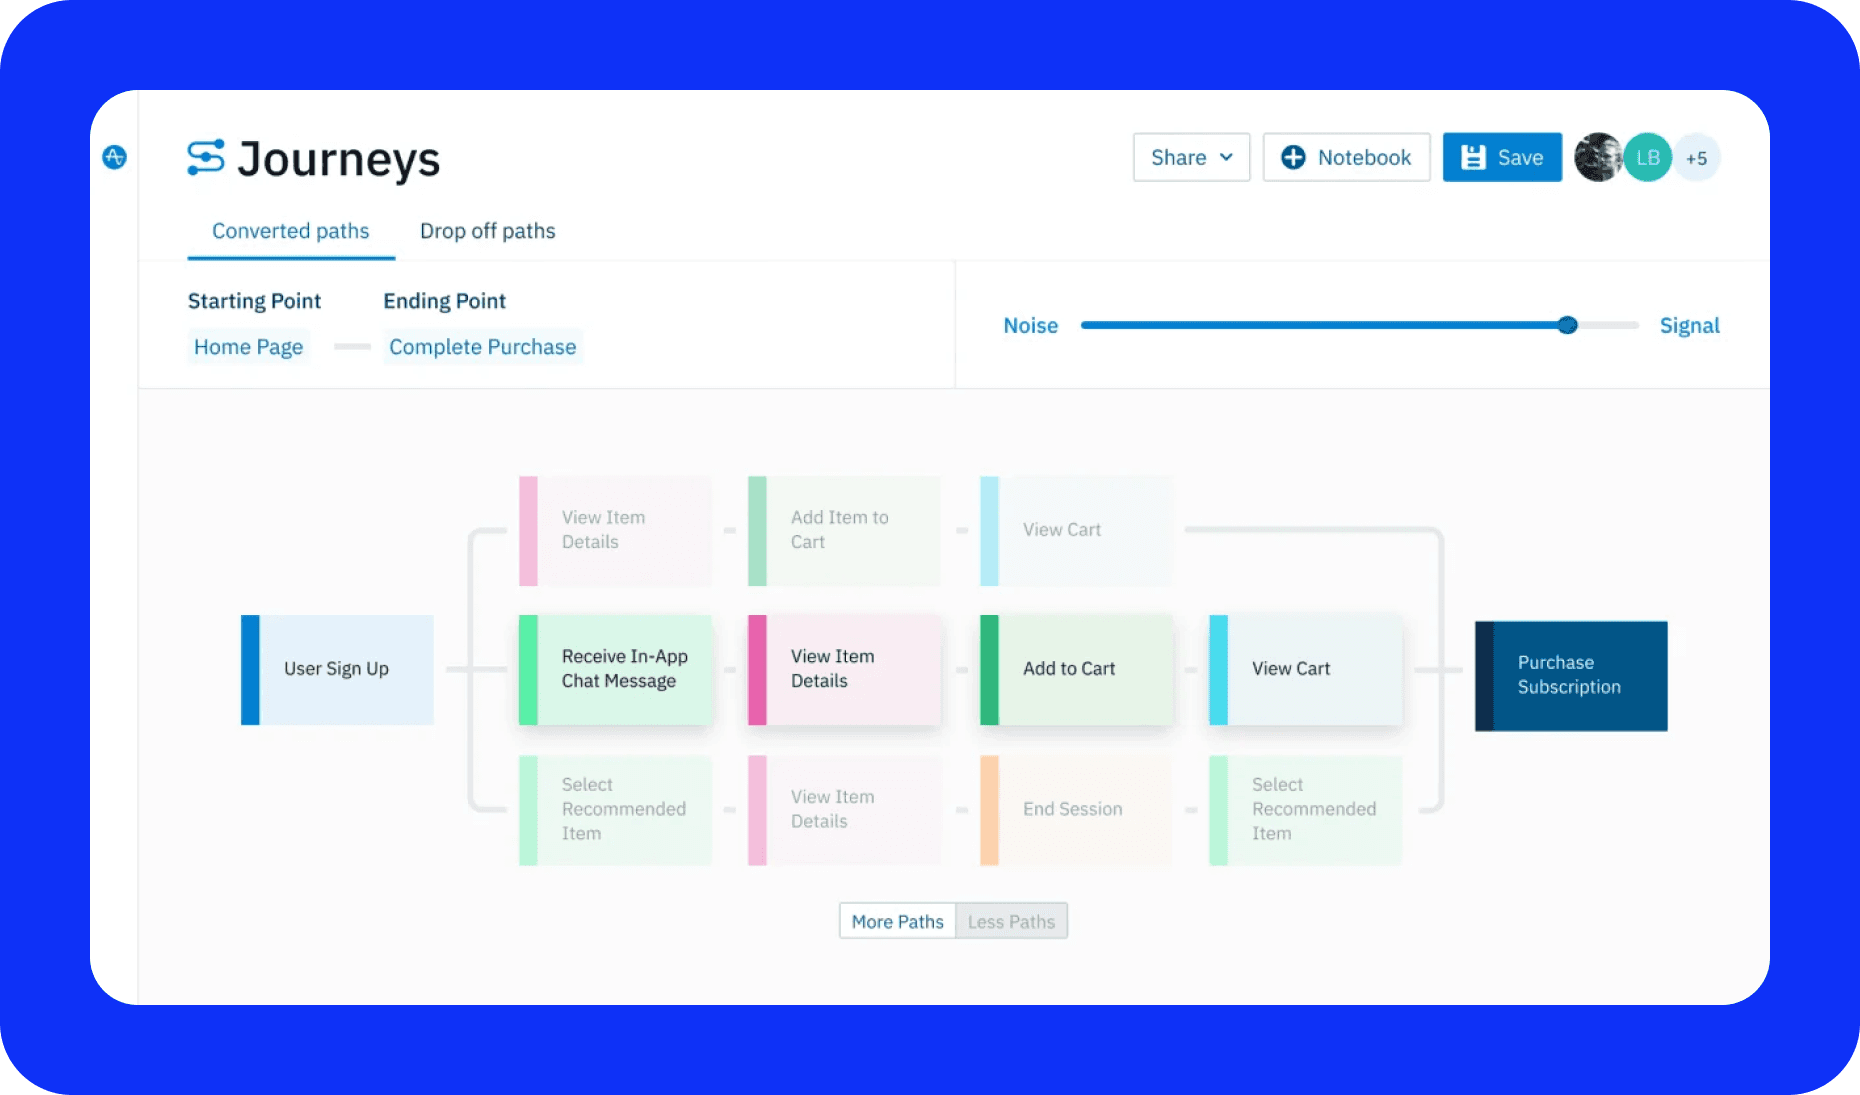
Amplitude is a cutting-edge product analytics platform that allows businesses to track, analyse, and optimise user behaviour across digital platforms. As a leading analytics tool, it provides real-time insights into user engagement, retention, and revenue patterns, making it an essential resource for analysts and business decision-makers.
Key Features
Cross-Platform Tracking: It allows businesses to track user behaviour across various platforms, creating a seamless picture of how customers engage across mobile, desktop, and more.
Real-Time Analytics: With real-time data capabilities, Amplitude provides immediate insights, allowing businesses to act swiftly based on current user trends.
Data Democratisation: Amplitude's user-friendly platform makes information accessible for both technical and non-technical users, facilitating data-driven decision-making across teams.
Growth Discovery Engine: It has predictive analysing capabilities with pattern recognition for user behaviour. Machine learning-powered insights enable trend identification and analysis.
Cohort Analysis and Segmentation: By grouping users based on behaviours, demographics, or attributes, Amplitude helps identify trends and tailor strategies for specific user cohorts.
[aa quote-global]
Fast Fact
The company's founders, Spenser Skates and Curtis Liu, created a company named Sonalight in 2012. Sonalight produces an Android app enabling users to send voice text messages. Along the way, they created analytical software to help them understand how users used the app.
[/aa]
The Data Analysis Process
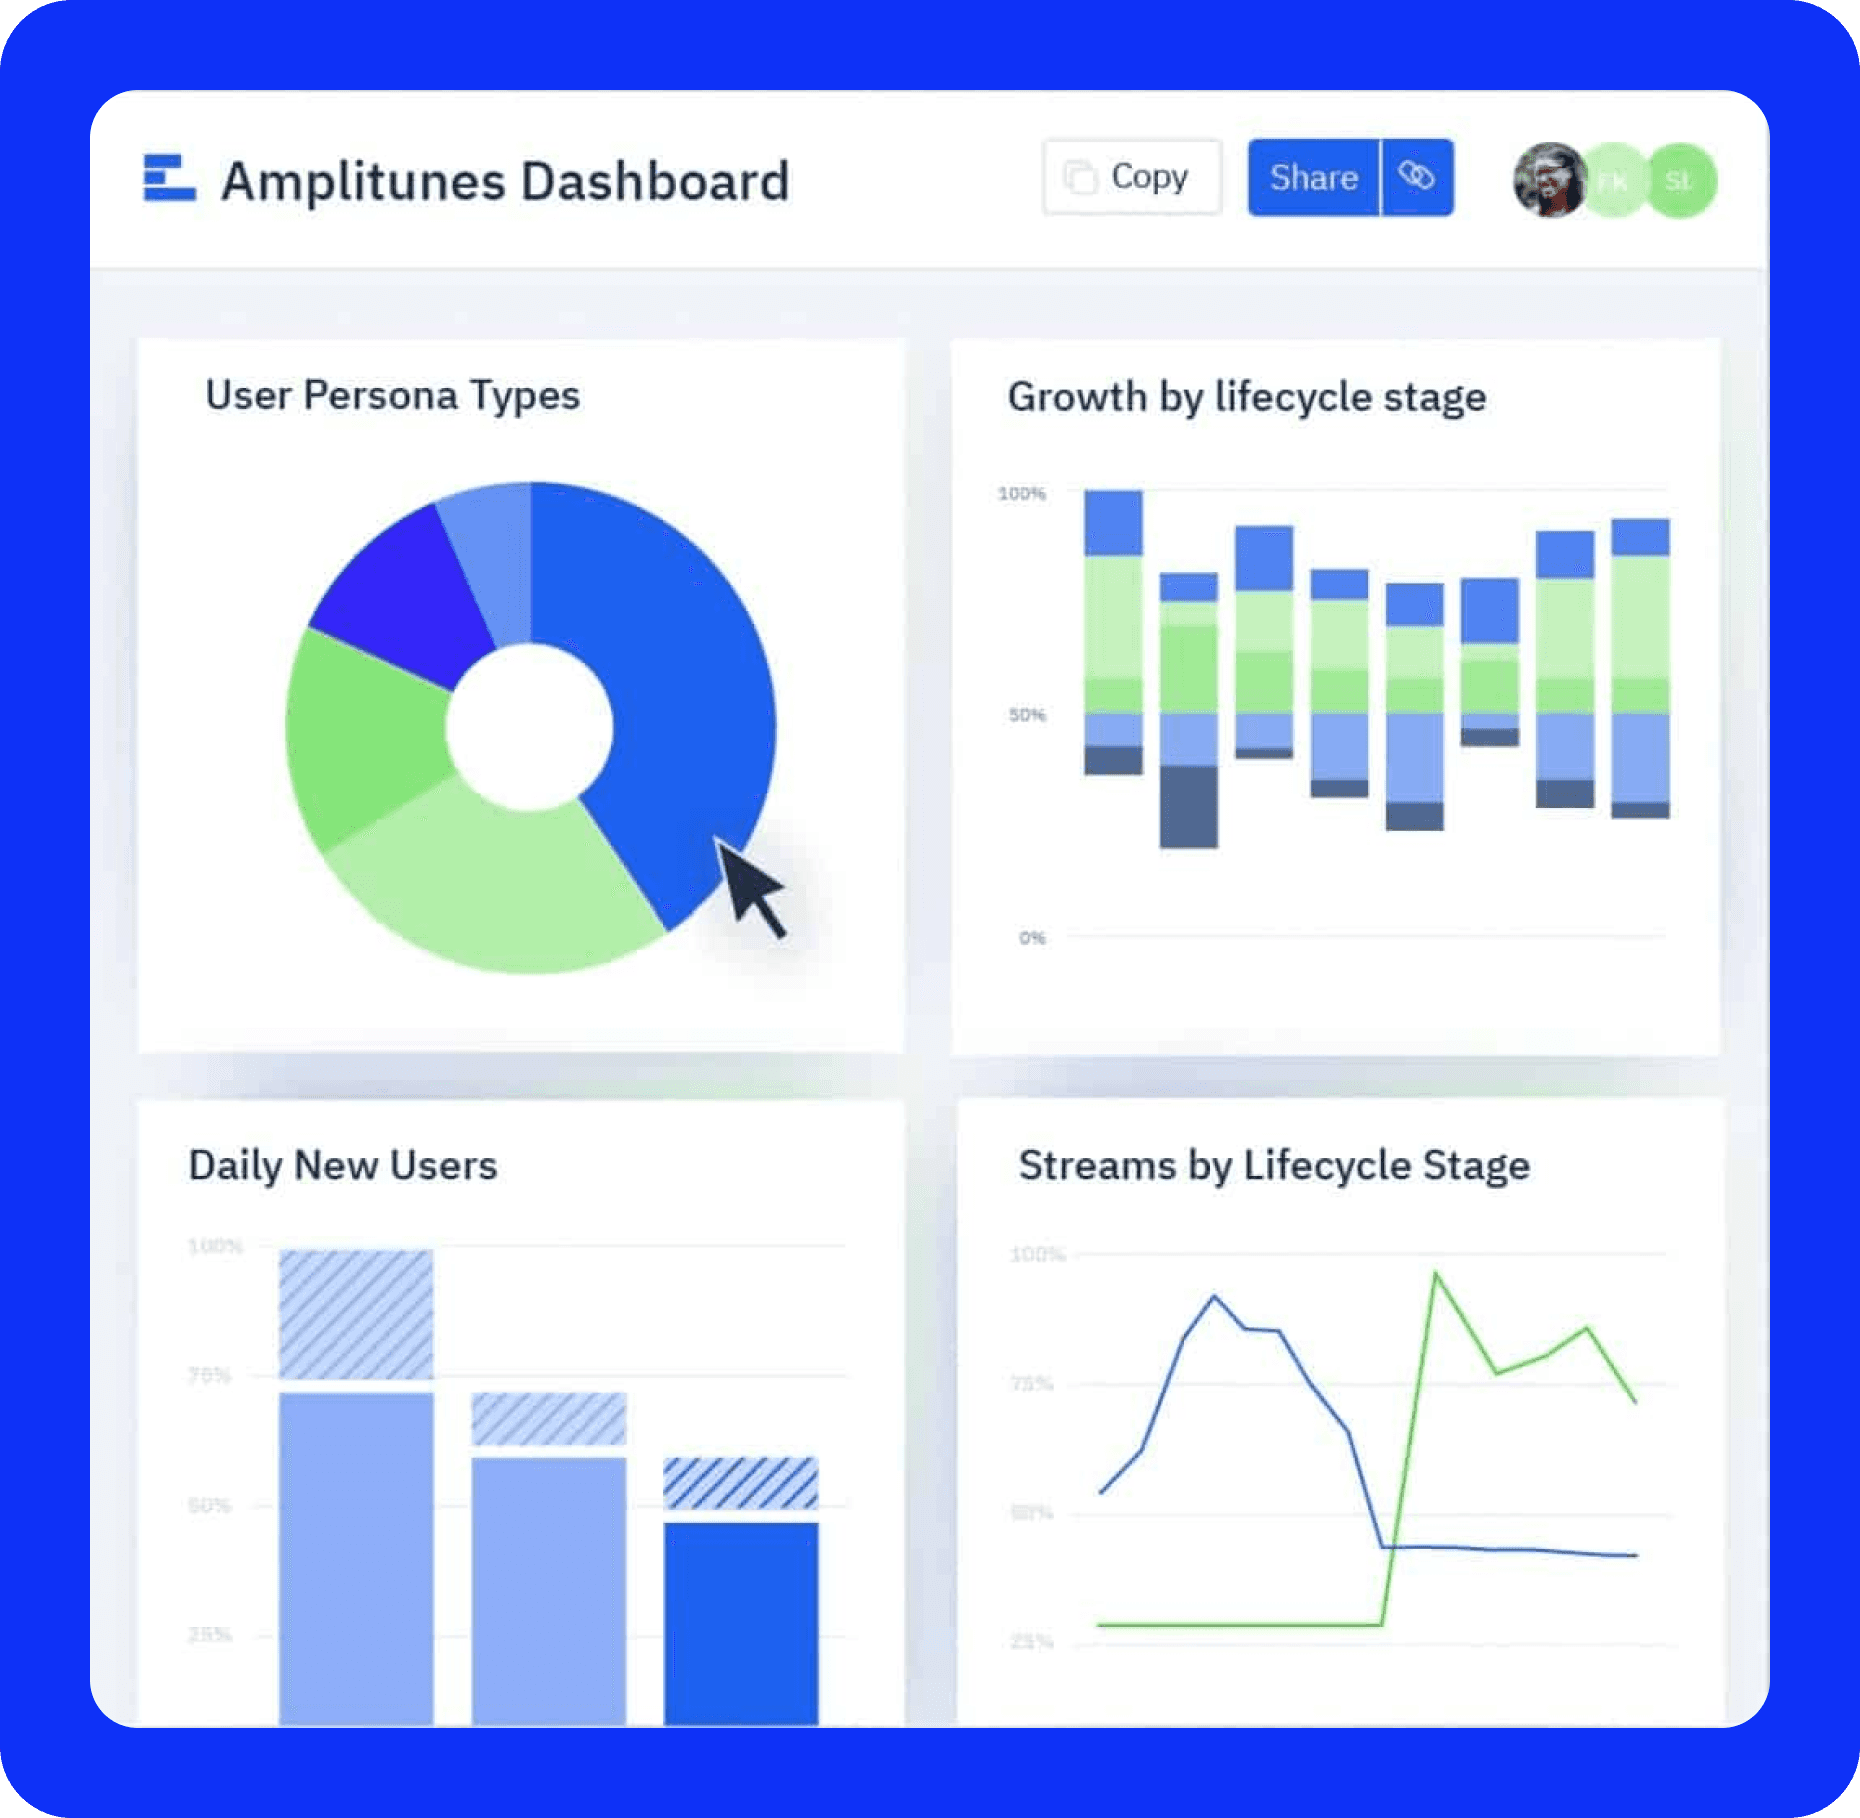
Amplitude Analytics facilitates streamlined data processing that assists analysts, product teams, and decision-makers in effectively analysing accumulated information.
1. Info Collection and Cleaning
Collecting raw data is the first step, and Amplitude supports easy statistics import from different sources, ensuring information quality through built-in cleaning tools.
2. Exploratory Data Analysis (EDA)
This phase involves identifying patterns, outliers, and critical informative points within the dataset. Amplitude's EDA tools enable users to explore user behaviour patterns effortlessly.
3. Hypothesis Testing and Statistical Analysis
Data analysts can run experiments and test hypotheses, enabling businesses to validate assumptions. Amplitude supports statistical methods such as regression analysis to identify correlations and causations in user actions.
Key Analysis Methods
Amplitude leverages several data analysis techniques to uncover actionable insights. Below are some primary methods that Amplitude enables for data-driven companies:
Cohort Analysis
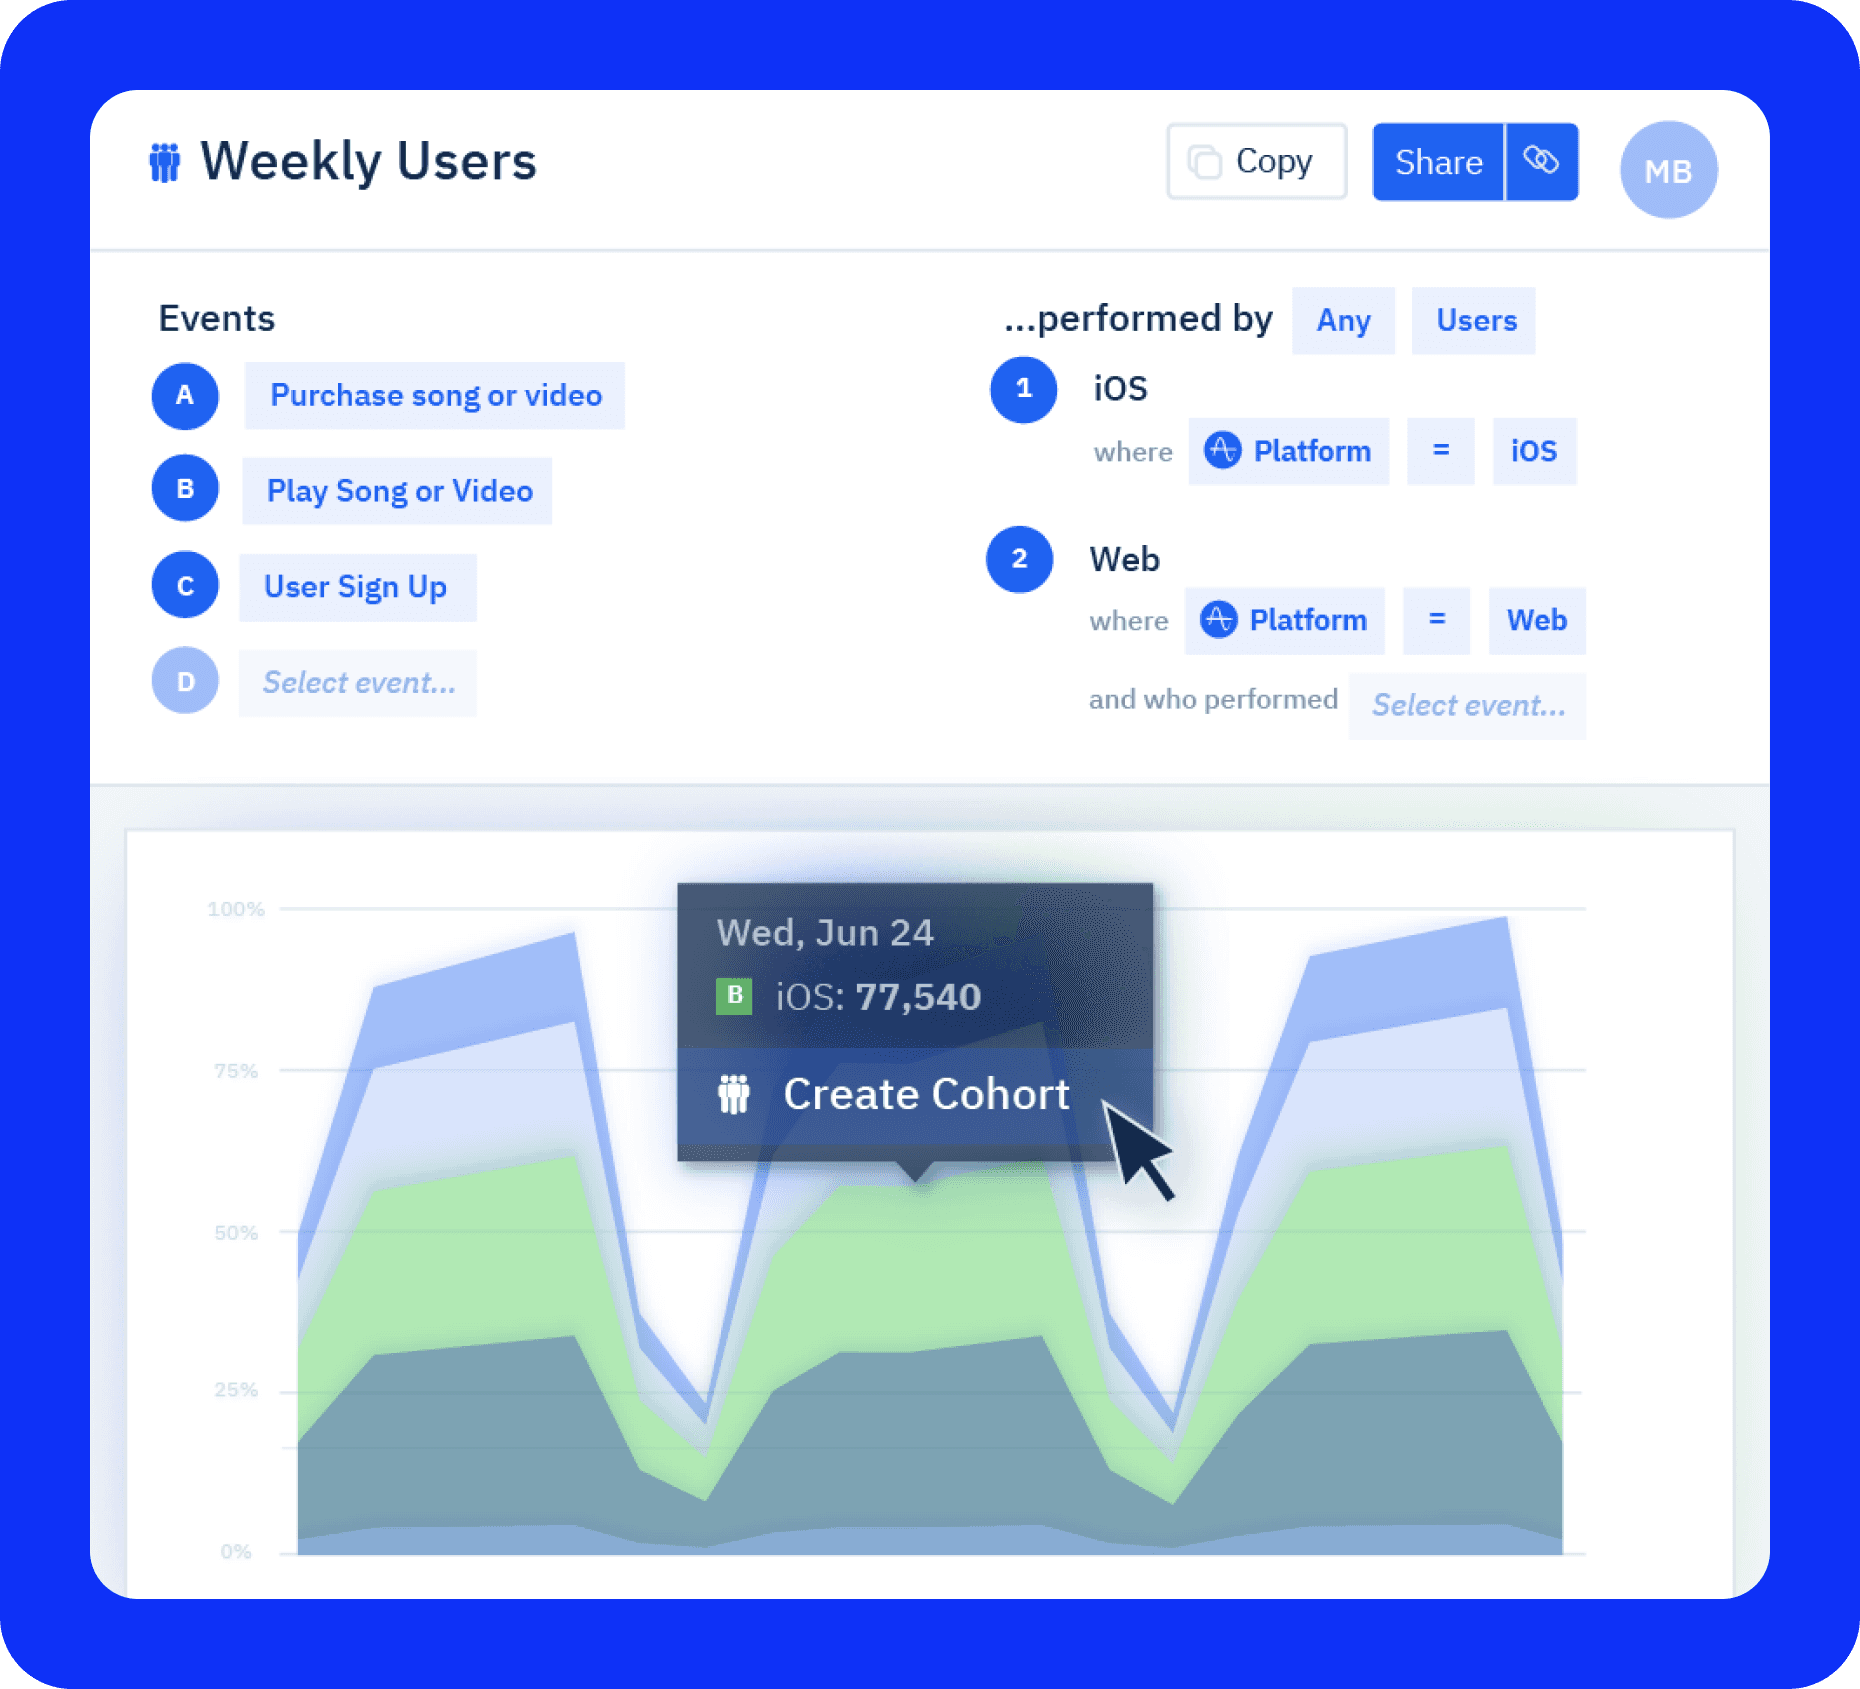
Cohort analysis allows companies to group users based on shared attributes or behaviours, which helps understand how specific user segments interact with a product. This technique is valuable in data-driven decision-making because it reveals trends across user groups over time, highlighting opportunities for engagement and retention.
Funnel Analysis
Funnel analysis visualises users' steps before completing a target action (e.g., signing up, purchasing). This data analysis technique helps identify drop-off points, optimise conversion paths, and understand which features are most critical to the user experience.
Retention Analysis
Tracking user retention rates is crucial to assess the long-term value of customers. Amplitude Analytics tool provides retention analysis, helping businesses understand how many users return to their product over specific periods, providing insight into product engagement and loyalty.
Behavioural Graphing
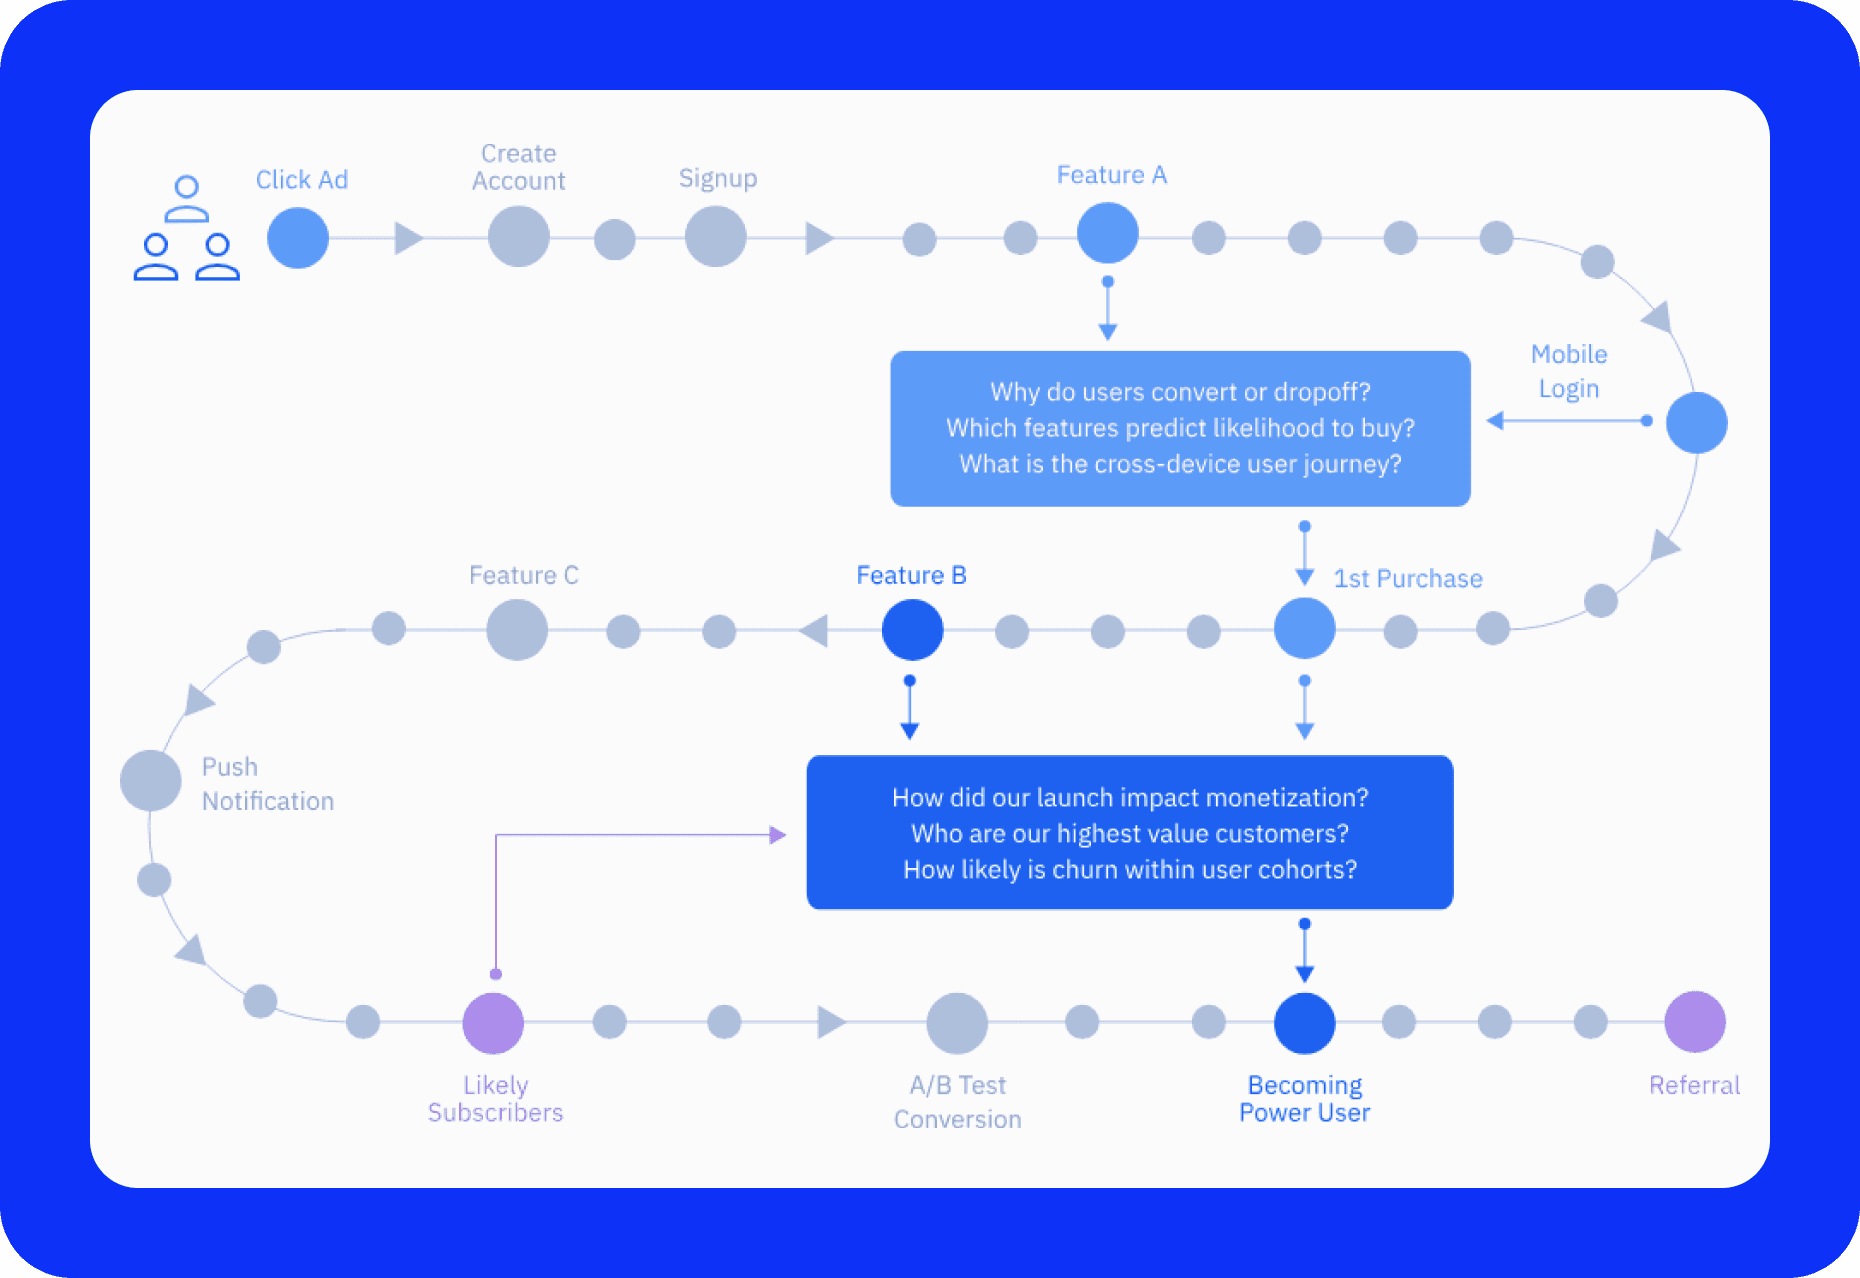
This data visualisation feature maps out user flows and behaviours, enabling users of data analytics to understand the relationships between various actions. Behavioural graphs are particularly useful in predictive analysis, helping forecast user behaviours based on past information.
Quantitative Analysis
Focuses on measuring and analysing numerical data points to understand user behaviour objectively. Amplitude helps calculate metrics like conversion rates, session durations, and engagement levels, providing quantitative data for decision-making.
Predictive Analytics
By analysing historical data and user behaviour, Amplitude can predict future user actions and trends. This allows businesses to address potential issues and optimise product experiences proactively.
Machine Learning
Amplitude leverages machine learning algorithms to automatically identify anomalies and patterns in user behaviour. This empowers analyst to uncover hidden insights and prioritise their efforts.
Google Analytics vs Amplitude
One of the most common comparisons in this sphere is between Amplitude and Google Analytics. While both tools provide valuable insights, they have distinct purposes and functionalities.
Differences in Data Analysis Approach
Google Analytics primarily tracks website traffic and overall performance, focusing on marketing metrics like page views, bounce rate, and session duration. It is a fantastic tool for SEO and digital marketing analysis but is limited in terms of behavioural metrics.
On the other hand, Amplitude Analytics specialises in product analytics and user behaviour tracking, offering insights into how users engage with specific features. It allows data scientists and analysts to analyse events and optimise processes based on behavioural info, making it more suitable for product-focused companies.
Google Analytics remains a strong choice for businesses focused on marketing metrics and website traffic. However, Amplitude Analytics is invaluable for companies looking to delve deeper into product usage patterns, providing insights that support everything from data collection to product decision-making.
Amplitude Analytics Competitors
While Amplitude is widely used for behavioural and product analytics, other companies offer comparable features. Here's a quick comparison of the top alternatives:
Mixpanel: Known for its product analytics capabilities, Mixpanel focuses on tracking user events and providing insights into user engagement and retention.
Heap Analytics: Heap offers an auto-capture feature, which automatically tracks all user interactions without requiring manual event setup. It's especially useful for companies that need comprehensive tracking without extensive configuration.
Kissmetrics: Designed primarily for e-commerce, Kissmetrics provides deep insights into customer acquisition, churn, and cohort analysis, offering specific tools for tracking users through the data analysis process.
Each of these tools has unique strengths, but Amplitude Analytics stands out for its intuitive interface, comprehensive feature set, and robust behavioural analysis capabilities.
Amplitude Analytics Demo and Onboarding
Amplitude Analytics offers a demo for businesses interested in exploring the tool's capabilities, which provides an overview of its functionalities and setup process. The onboarding process is streamlined, with ample resources to guide users through implementation and use.
Essential onboarding resources include:
Documentation and Tutorials: Amplitude offers extensive documentation and guided tutorials to help users understand key features, from data cleaning to regression analysis.
Support: The platform provides dedicated support to assist users in setting up tracking events, visualising statistics, and optimising their data analysis techniques.
Conclusion
Amplitude Analytics proves to be a valuable tool for businesses seeking to leverage received information for growth and improvement. Its comprehensive features, sophisticated analysis capabilities, and user-friendly interface make it a standout choice for companies of all sizes.
Whether you're focused on product development, marketing optimisation, or business strategy, Amplitude provides the insights needed to make informed, data-driven decisions.
FAQs
What is the role of data analysis in marketing?
Data analysis plays a pivotal role in marketing. Businesses can create more personalised marketing strategies by analysing customer behaviour, preferences, and trends. This approach not only improves customer engagement but also boosts the effectiveness of marketing campaigns.
How many users does Amplitude have?
Amplitude is the top choice by digital disruptors. 26% of the Fortune 100 use Amplitude to answer strategic questions about how customers use their products and understand how to use these insights to maximise business outcomes.
Does Amplitude use AI?
Most behavioural cohorts rely on three to five manually designed signals, whereas Amplitude's predictions use a transformer-based AI model with hundreds of behavioural signals.
Read also

